
In my first and second posts in this series, I argued that it’s time for arts and culture organizations to start capturing, measuring, and analyzing data to help grow your audiences and revenue. I also detailed what I believe are the top ten data points you should know, showed you how to calculate them, and explained why they’re so important to track and improve. In this post, I’d like to share with you the results of a survey in which I asked arts organizations to share their metrics with me.
Eighty-six organizations responded, with staff sizes ranging from 1 to 400 and annual budgets ranging from $17,000 to $125 million. When using wide ranges like this, and trying to get a value to compare to your organization, I think it’s best NOT to use the average number, but rather the median, or the “value or quantity lying at the midpoint… such that there is an equal probability of falling above or below it.” My reasoning is that the median is less easily skewed by outlying numbers, whereas an average can be grossly affected by an outlier. (For example, that $125 million at the top of the budget range is an outlier; the next nearest was $18 million.) In the metrics above, the median staff size was 9 and the median budget $1.8 million, which sounds about right for a “typical” arts and culture organization.
As you compare your numbers to those below, please remember that there is no right or wrong number except what works for your organization. It is, however, important to measure these numbers and track them from year to year, making efforts to improve them where you can. On which of these metrics are you underperforming compared to the median? Why is that, and what can you do to improve it?
An interesting thing to notice is that the number of responses to our questions decreased as the complexity of the calculation (and ability to gather the necessary data) increased. Having an integrated CRM—instead of separate ticketing, fundraising, and marketing systems—makes this much easier to track and measure.
Without further ado, here are our results. For each metric, we give you the high, the low, and the median. If you need to revisit the calculations or reasons why these matter you’ll find them in my original posts here and here.
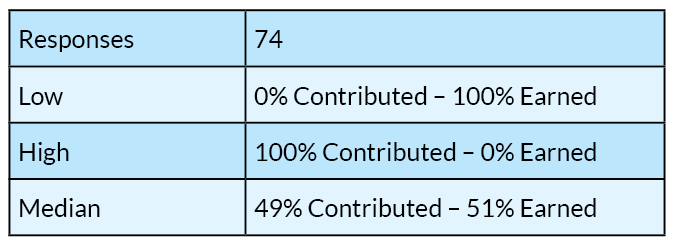
CONTRIBUTED AND EARNED INCOME
This is one of the most common metrics asked by granting organizations and Board members. These results show that a fairly equal split between earned and contributed revenue is most common. I don’t believe there is any universal “right” balance, except what works for your organization, but it’s important to measure it every year and be able to explain why it might be shifting.
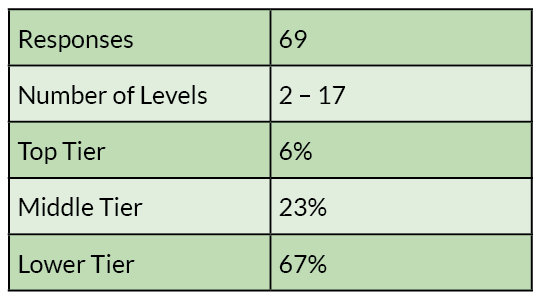
PERCENTAGE OF DONORS IN EACH GIVING LEVEL
Note that this is a measurement of individuals, not dollars. Because the number of tiers varied so widely, we broke the tier levels into three groups so we could compare one organization to another. Viewed this way, we see that the majority of donors are in the lower third of the tiers.
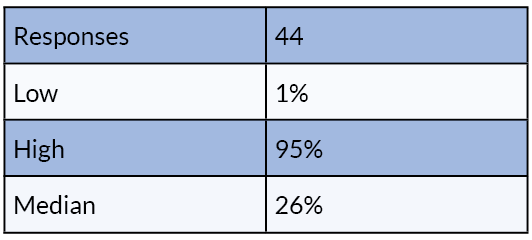
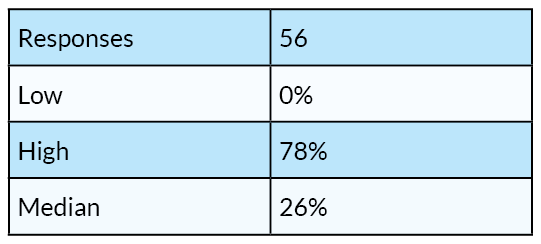
PERCENTAGE OF DONORS WHO LAPSE
Donors who lapse rarely come back, so it’s important to stay on top of this metric year after year. According to our results, organizations lose 26% of their donors each year, which means it’s important to aggressively recruit brand new donors to compensate for this loss.
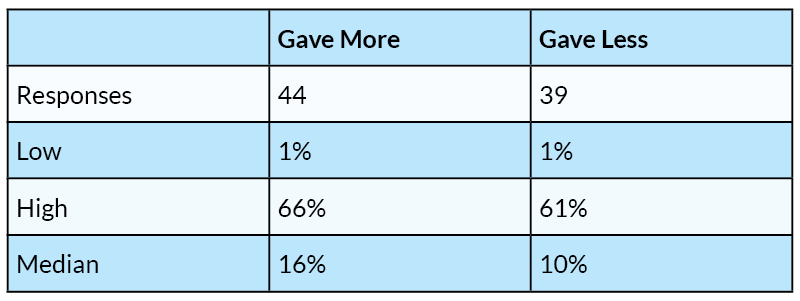
PERCENTAGE OF DONORS MOVING UP OR DOWN
Changes in donor behavior are an important signal of how your organization is doing. While many donors renew their commitment at the same level year after year, movement up or down can be a sign of whether your patrons continue to perceive value in their relationship with your organization. These metrics show that while there is a wide variety in the results if you have more donors that are increasing rather than decreasing their annual giving each year, you’re doing something right!
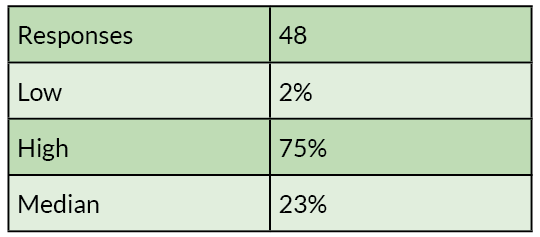
PERCENTAGE OF SUBSCRIBERS/MEMBERS WHO DONATE
This metric is important because it shows positive movement from appreciating your organization for its pure entertainment value to more altruistic support for your mission. The survey says that 23% of subscribers also donate to the organization. To move that number higher, make sure you have all ticket buyers on an engagement strategy, or patron journey, to show them the value of their support.
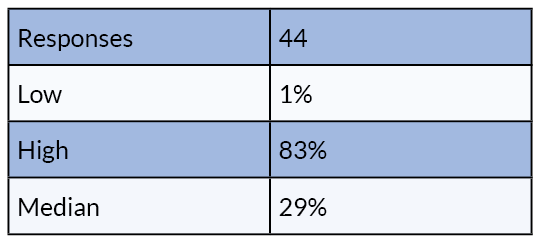
PERCENTAGE OF TICKET BUYERS WHO SUBSCRIBE
Many of the organizations I talk to are actively working on improving this number, which in our results, shows that only 29% of a performance’s seats are filled by subscribers. Again, strategically marketing to the first and second-time single ticket buyers is a key step on the patron journey worth your attention and investment.
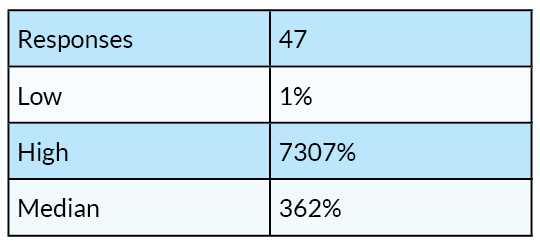
TICKET SALES PROMOTIONAL ROI
Simplified, this number shows how much you have to spend in order to sell tickets. While it’s interesting to know how you compare to other organizations in this metric, there are many market variations that make this less useful as a comparison. It is, however, important to know and track within your own organization year after year. In basic terms, our results below say that organizations need to generate $3.62 in earned revenue for each $1 they spend promoting those programs.
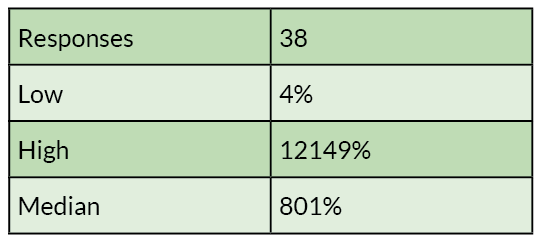
FUNDRAISING PROMOTIONAL ROI
This metric shows how hard you have to work to raise money from donations (without the cost of fundraiser salaries factored in). Just a reminder: don’t compare Ticket Sales and Fundraising Promotional ROIs within your organization. They’re not on the same plane, they only create tension between departments, and both earned AND contributed revenue are important. In basic terms, our results below say that organizations need to generate $8.01 in contributed revenue for each $1 they spend on fundraising.
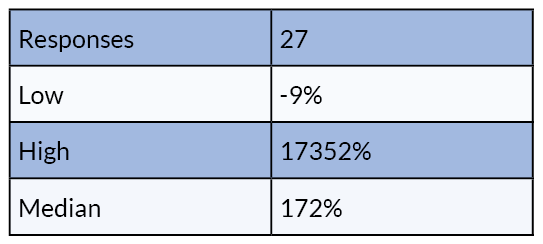
DONOR EVENTS PROMOTIONAL ROI
Organizations who host donor events not only increase their fundraising efforts but see additional growth in other areas from bringing people together. So, while the ROI is relatively low compared to the metrics above, (earning $1.72 in gifts from every $1 spent on the events), having these events will deepen your patrons’ engagement with your organization.
PATRONS UNDER 55 (50% of the US Population is 20-54)
I know that most answers to this question are a general guess, but it’s important to look at the result below: organizations who responded to our survey believe that 26% of their audiences are under 55. That’s 24% below the national averages, which means that our audiences are older then they should be. We’ll do a post later this year about why that matters and what you should do about it, but anything you can do to draw young adults to your performances or exhibits is well worth the effort.
Now that you know how to calculate these metrics, and see what other organizations are experiencing for themselves, you’ll probably think of other data points that are more essential to your organization that aren’t included here. Or, perhaps you’ll find that you’re underperforming relative to your peers in some of these areas. What’s important isn’t necessarily what metrics you track, but that you track them consistently each year and make plans to improve each one. Paying attention to the ones that matter most to you and your leadership, and designing a strategy to improve those numbers, will ensure you reach the goals you set for continued growth and success.